Report Command
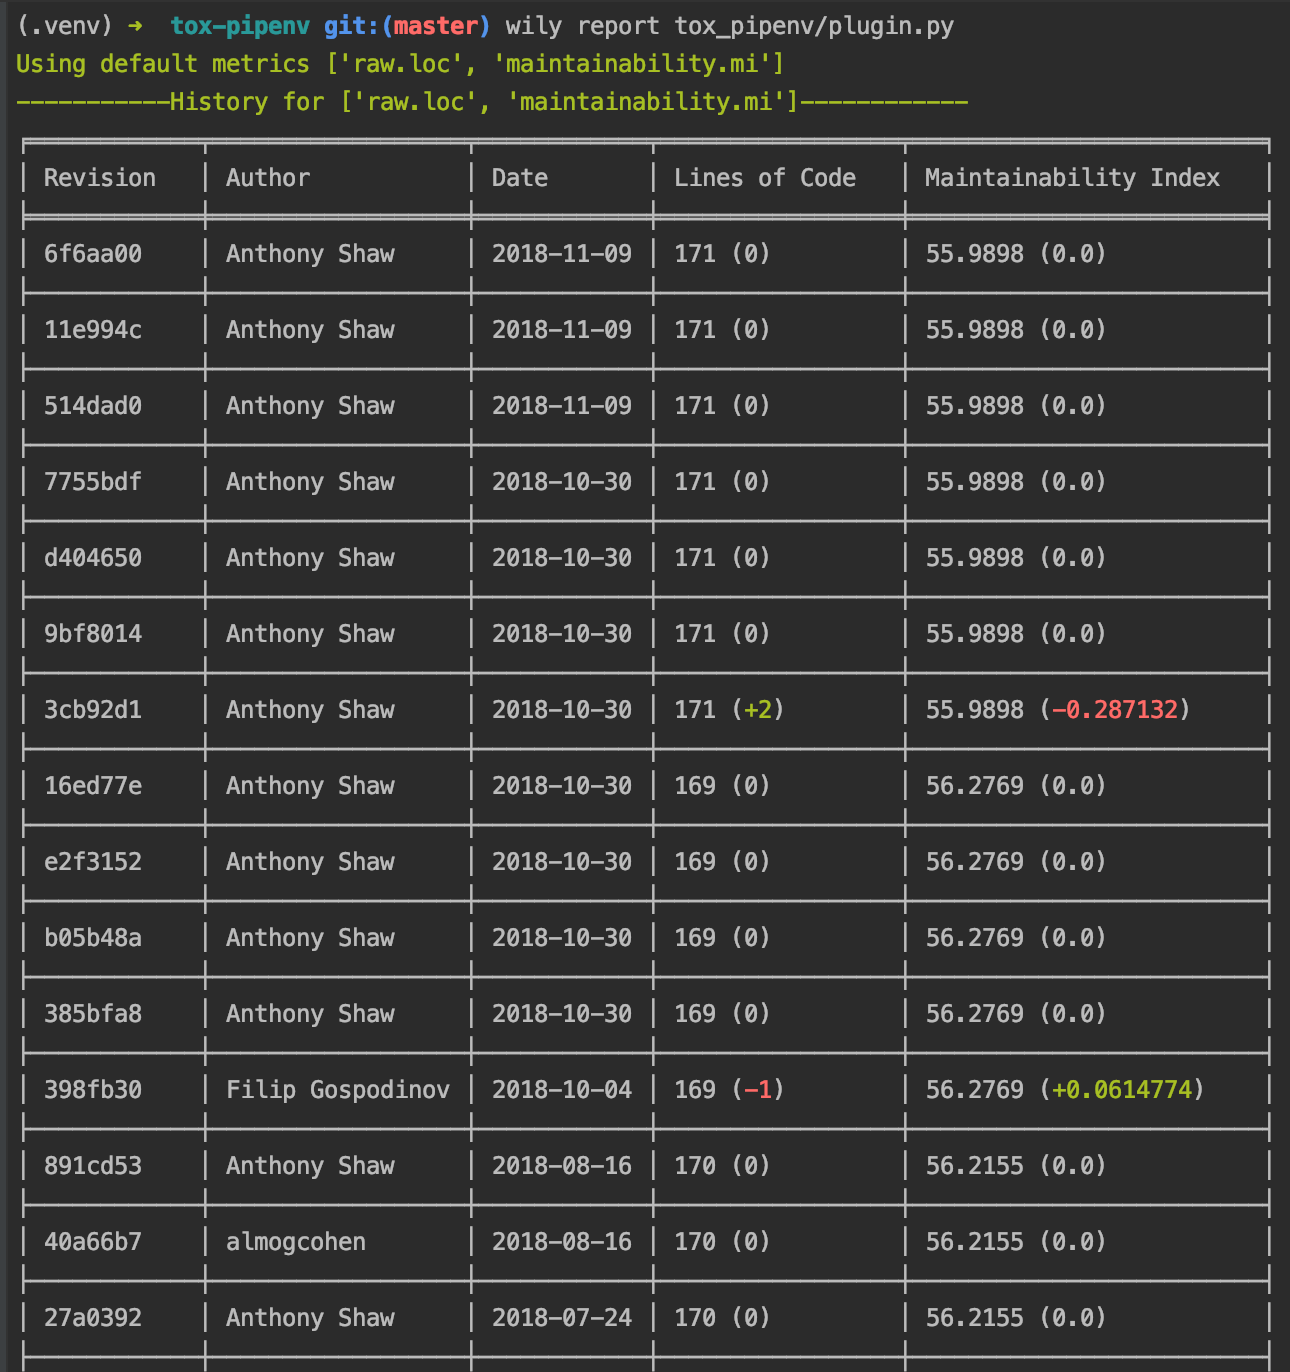
The report command will show a CLI table or an HTML report of metrics for the file provided. It is useful for comparing differences and trends between revisions.
Examples
To show a report, simply give the name or path to the file you want to report on.
$ wily report example.py
By default, wily will show all available metrics. You can specify which metrics to display by providing metric names as arguments (run wily list-metrics for a list).
$ wily report example.py loc sloc comments
Wily report will show all available revisions, to only show a set number, add the -n or --number flag.
$ wily report example.py -n 10
Wily report will display all revisions, to only show those where metric values have changed, add the -c or --changes flag.
$ wily report example.py --changes
Similar to the index command, wily report will not show the commit message. To add the message to the output, add the --message flag.
$ wily report example.py --message
By default, wily will show a CLI table report of metrics. To create an HTML report instead, pass the --format HTML option.
$ wily report example.py --format HTML
