Graph Command
The graph command generates HTML graphs for metrics, trends and data in the wily cache. The wily cache must be built first using the Build Command.
Examples
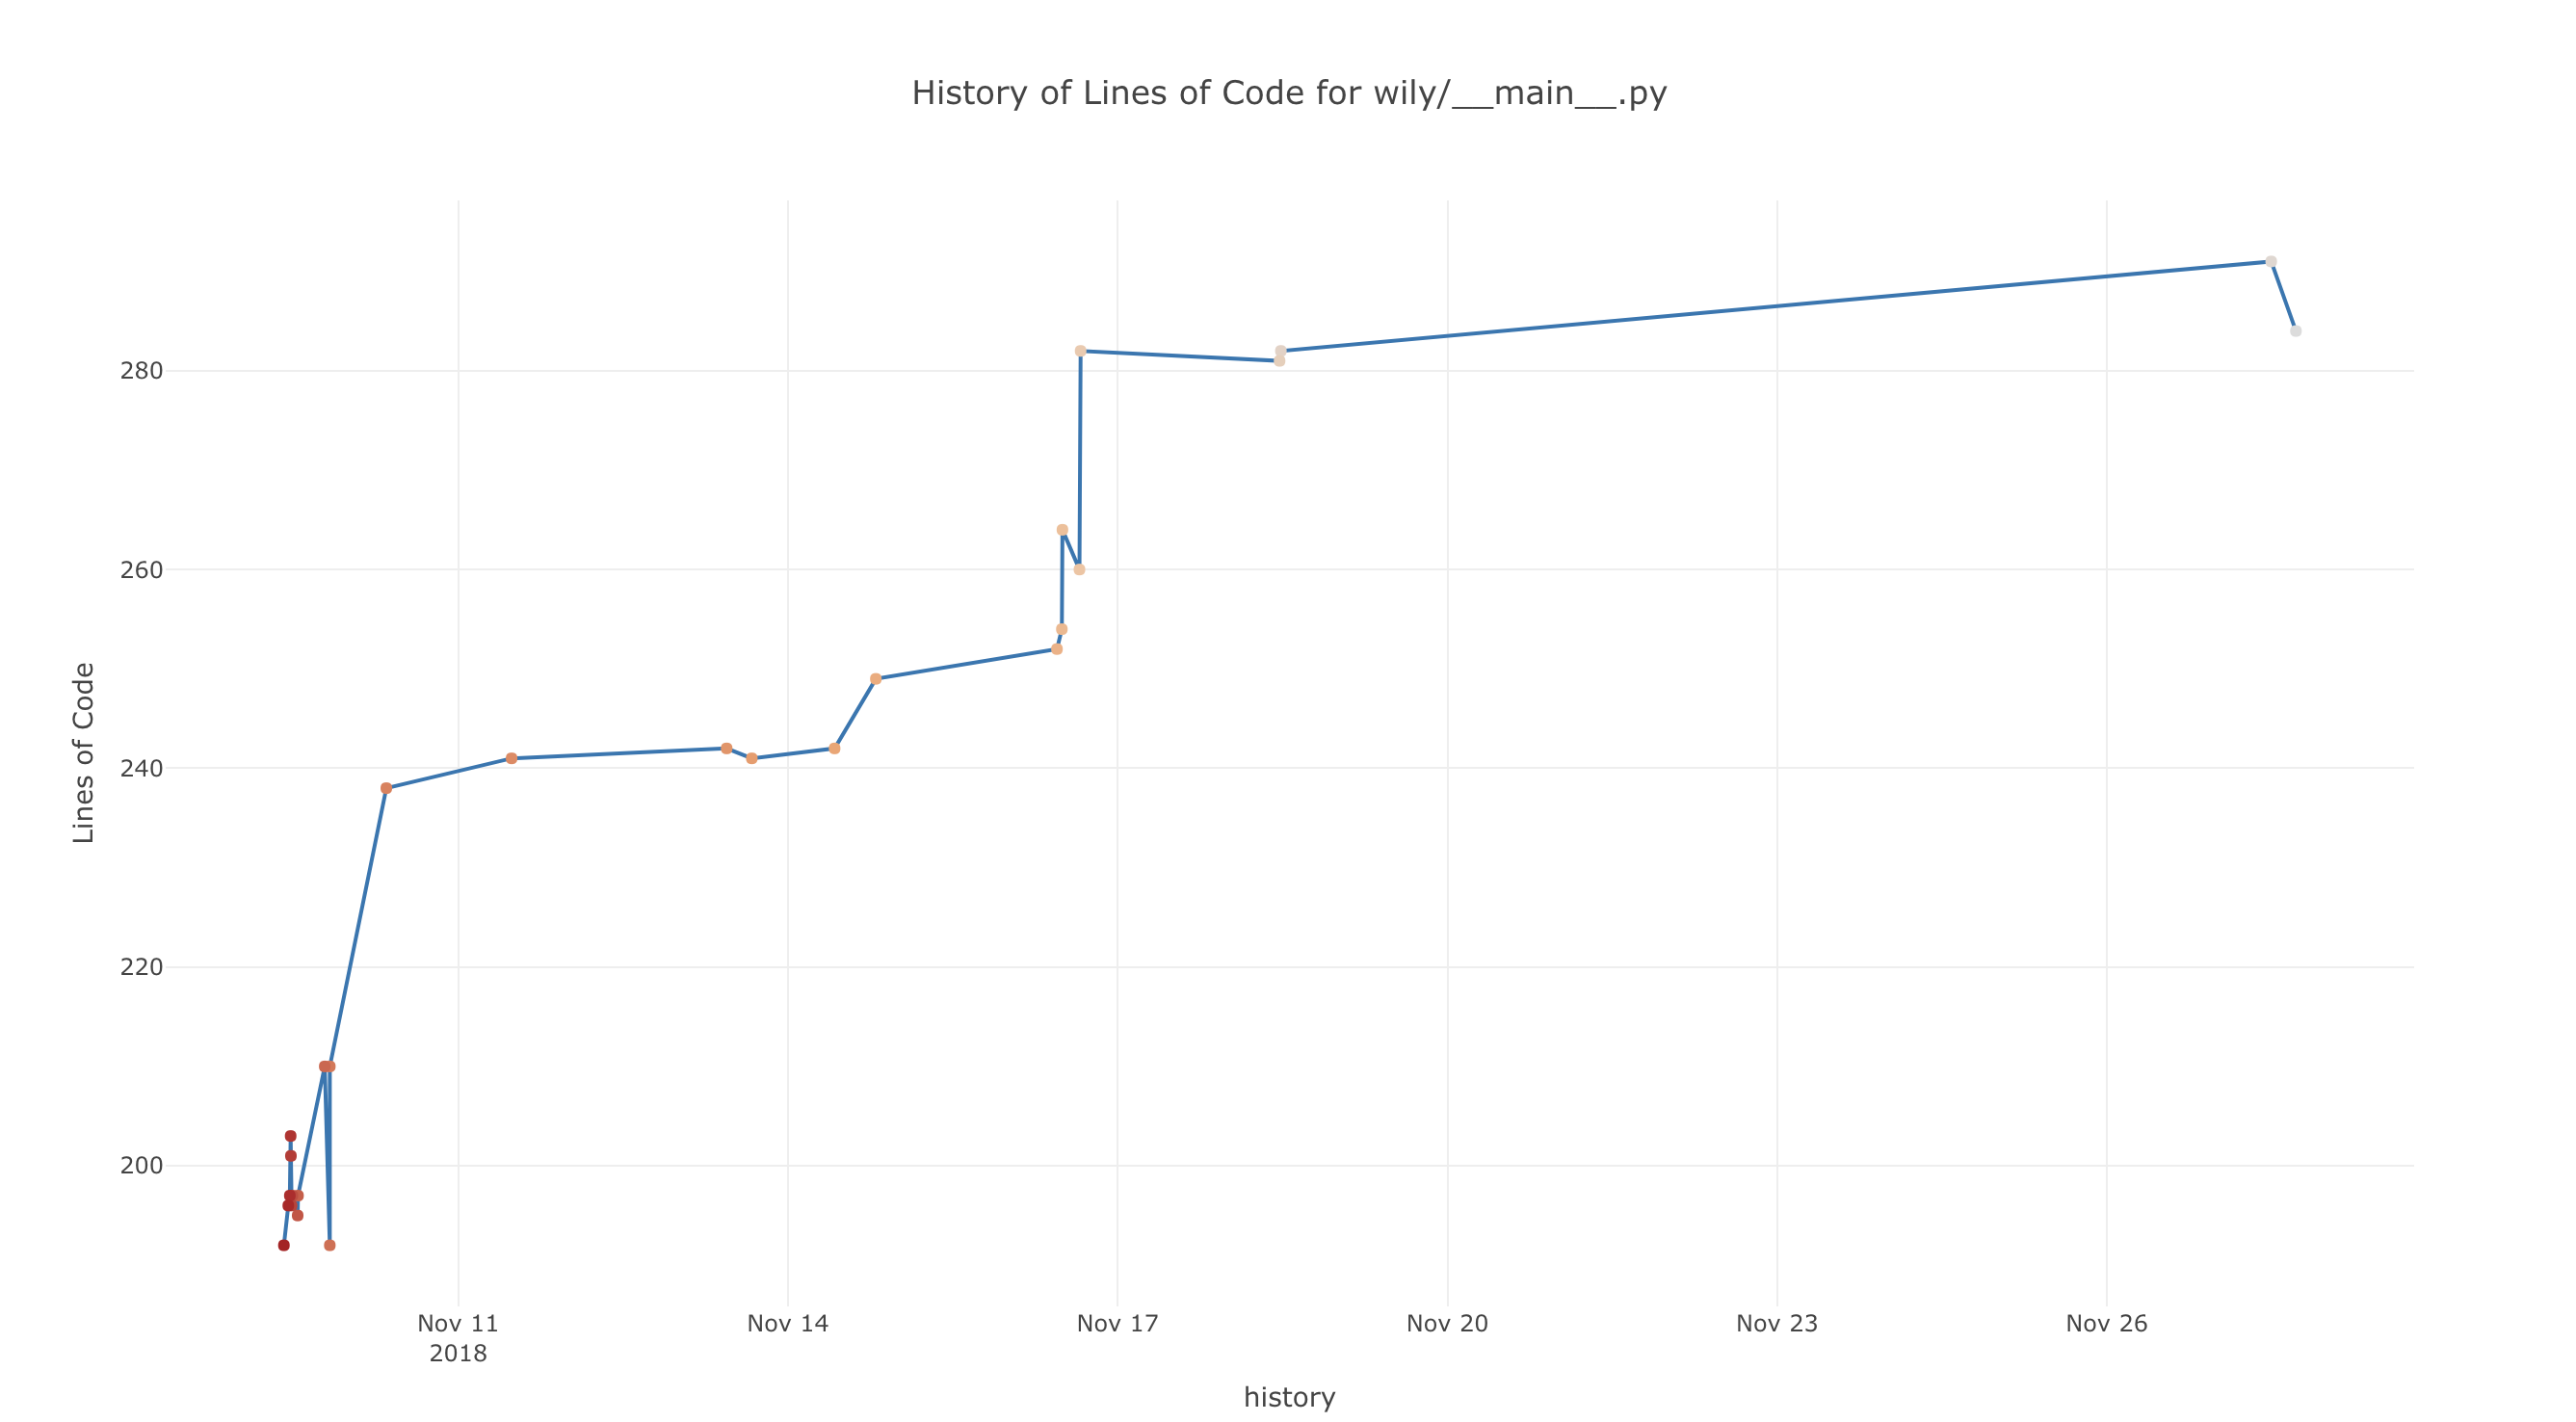
wily graph will take 1 or 2 comma-separated metrics as the -m option. The first metric will be the Y-axis and the 2nd metric (if provided) will control the size of the bubble.
$ wily graph example.py -m loc
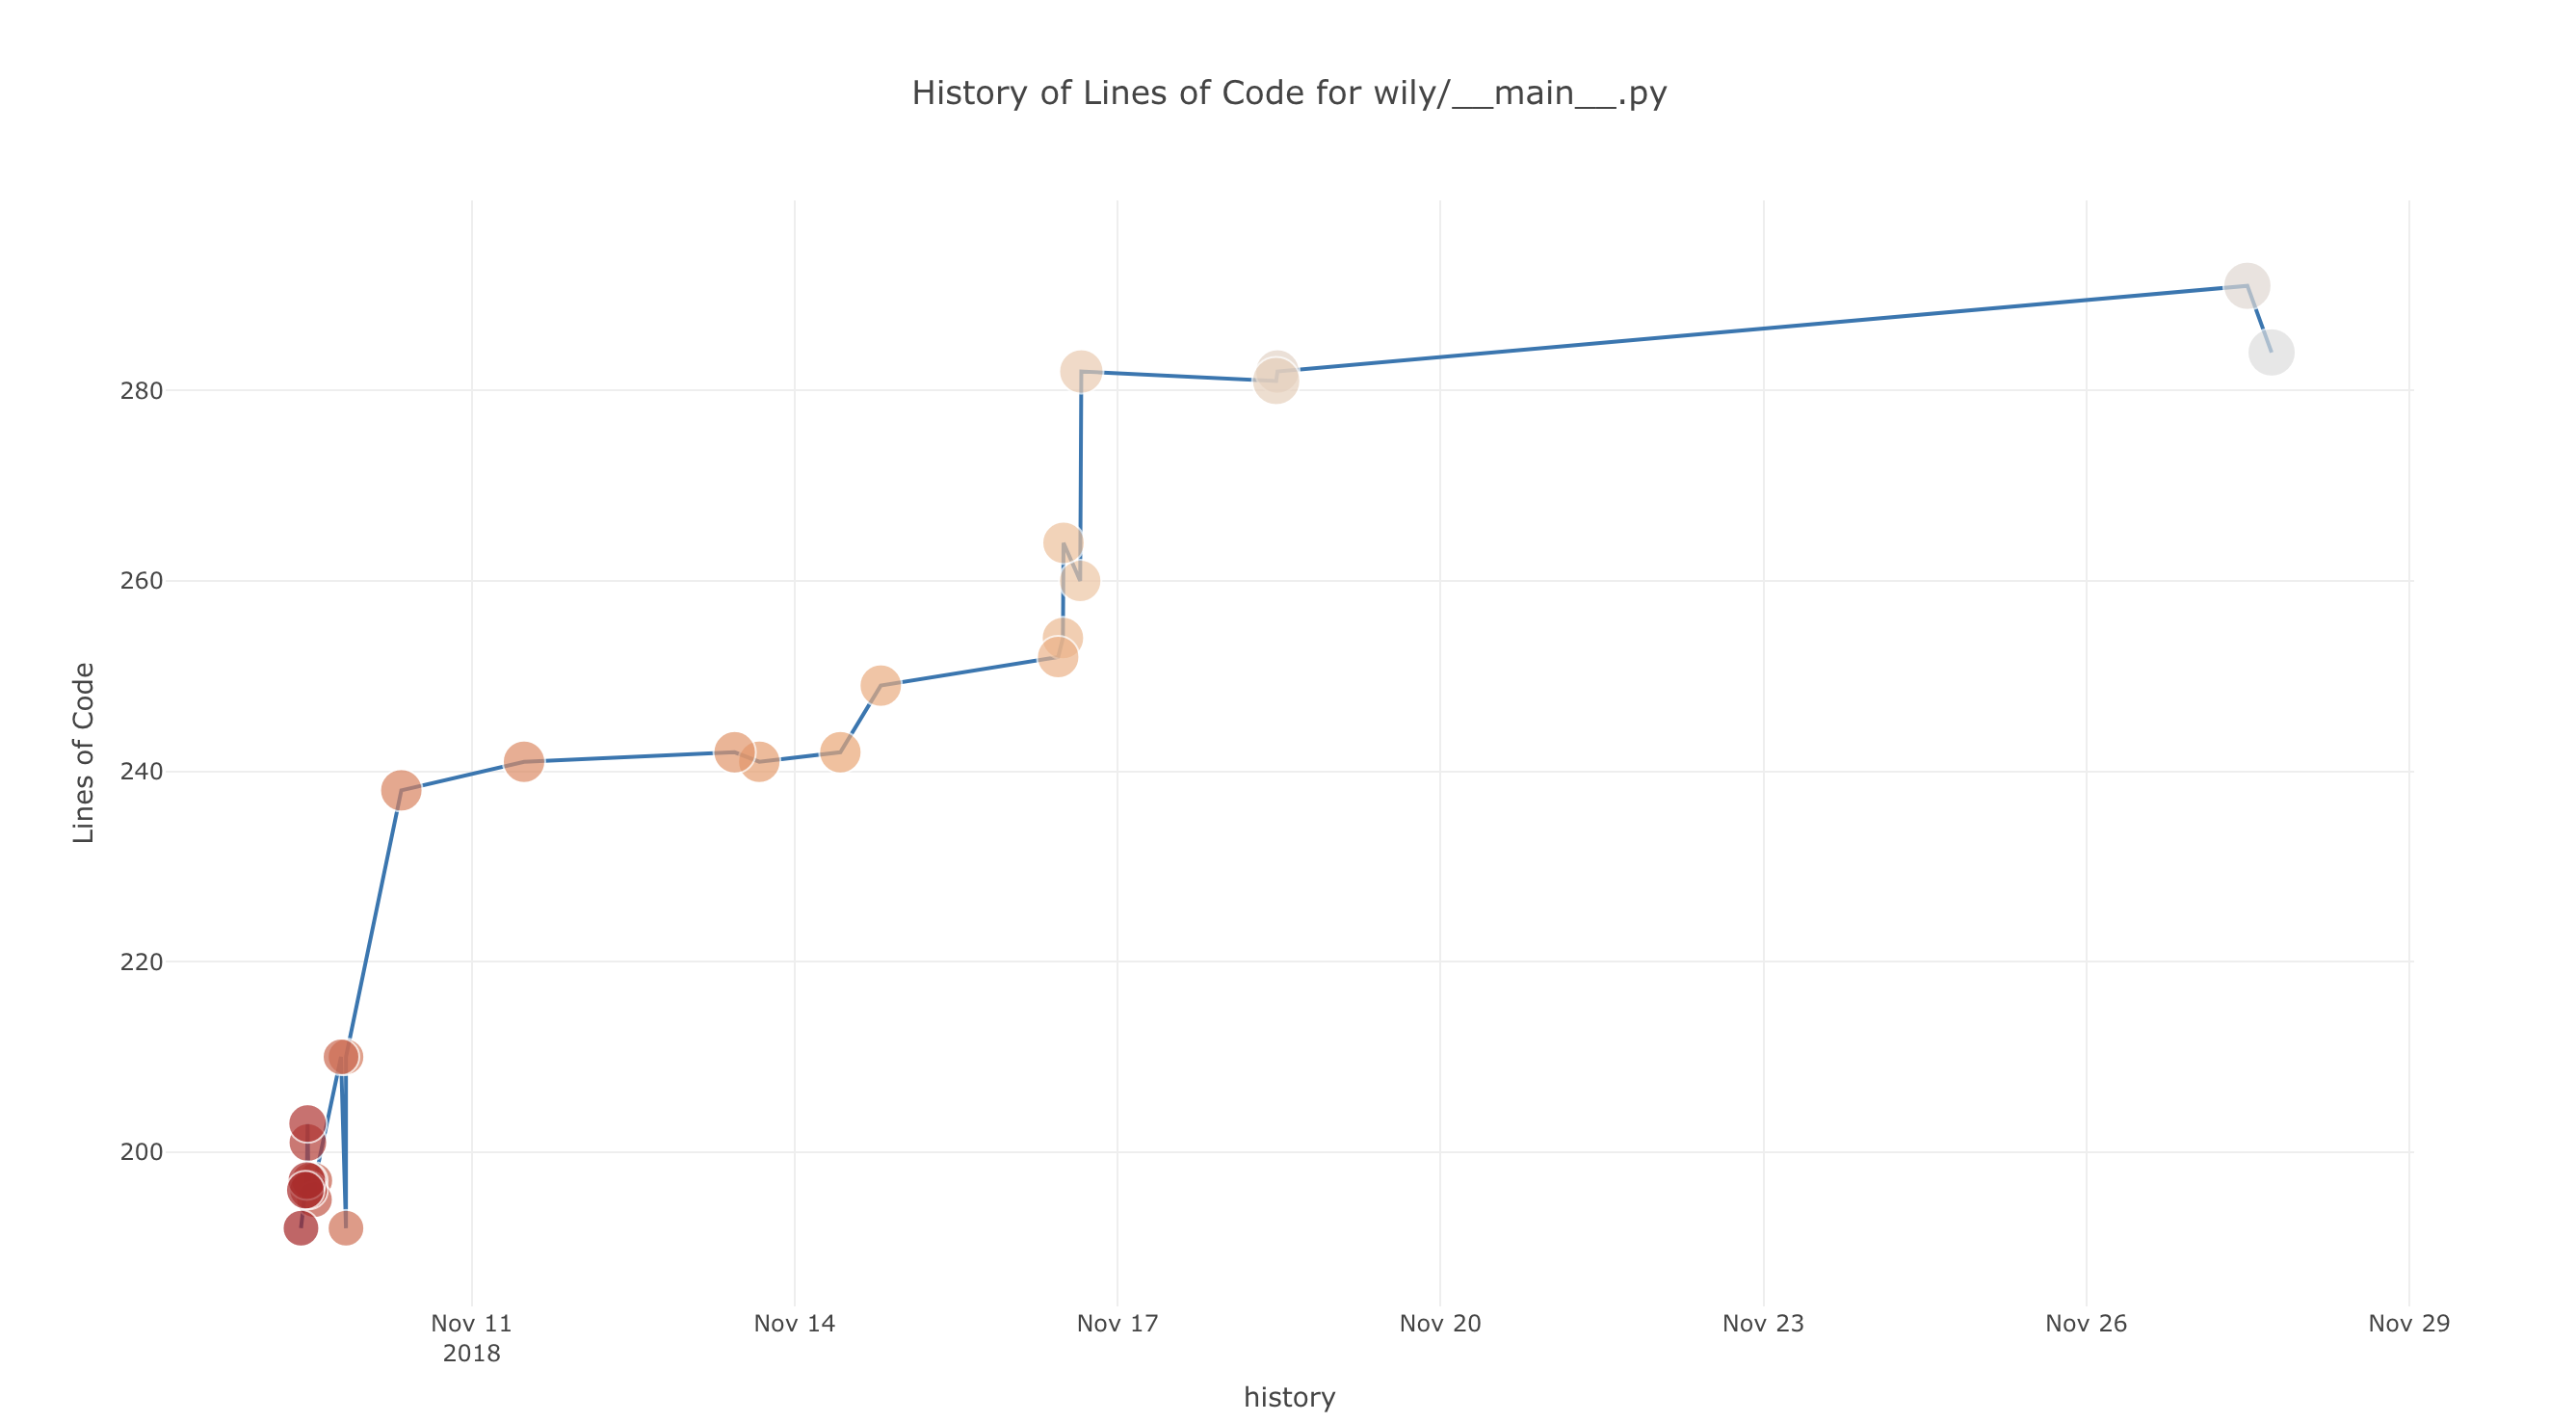
You can provide a second metric which will be used to control the size of the bubbles on the scatter diagram.
$ wily graph example.py -m loc,complexity
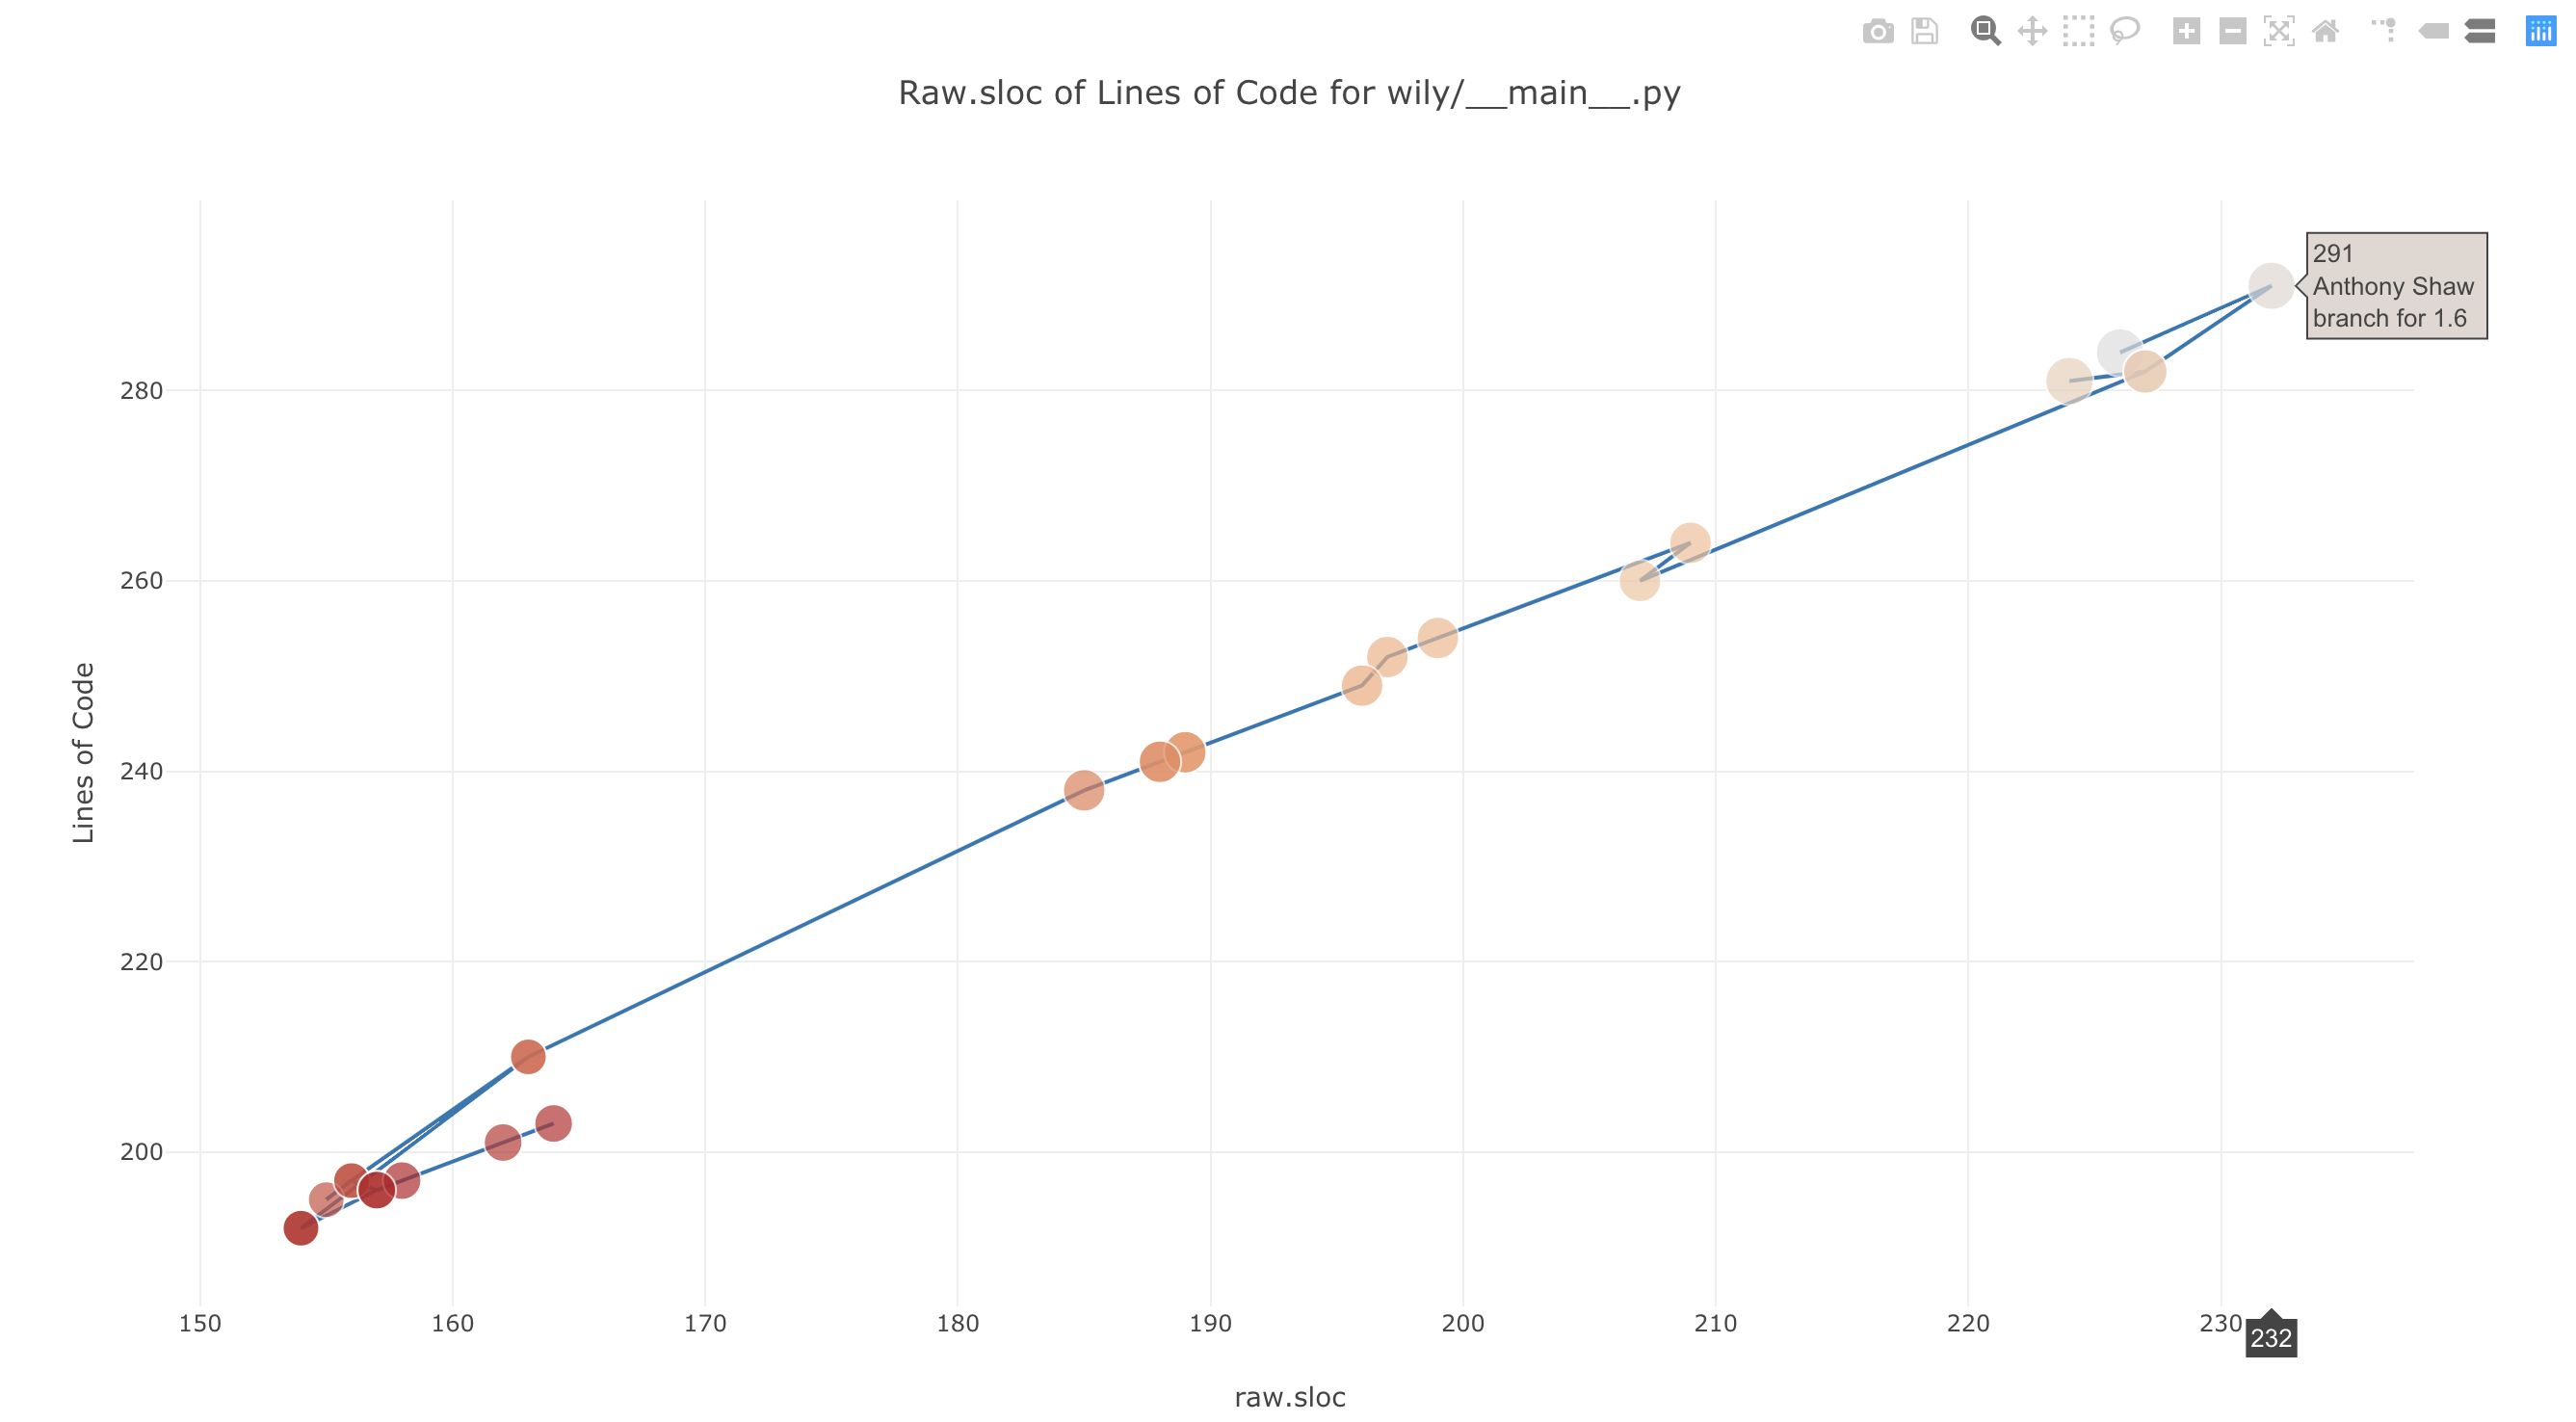
The x-axis will be the historic revisions (typically git commits) on a scale of the revision date. You can change the x-axis to a specific metric. If you do so, the color of the bubble will get darker as the revisions go from 0-n, where n is the last revision.
$ wily graph example.py -m loc,complexity --x-axis sloc
You can provide more than one path for wily graph so it displays one line per file path. If the path is a directory, all files contained in it and subdirectories will be added to the graph.
$ wily graph example.py example2.py example3.py tests/ -m loc
If one or more of the provided paths is a directory, you can use the --aggregate option to get a line with aggregated total metric values for all files in that path.
$ wily graph tests/ -m loc --aggregate
By default, wily graph will only plot revisions where metric values have changed. To show all revisions, use the --all option.
$ wily graph tests/ -m loc --all
By default, wily graph will create a file, wily-report.html in the current directory and open it using the browser configured in the $BROWSER environment variable (the default on the OS).
To save the output to a specific HTML file and not open it, provide the -o flag and the name of the output file.
$ wily graph example.py -m loc -o example.html
By default, wily graph will create an HTML file containing all the JS necessary to render the graph.
To create a standalone plotly.min.js file in the same directory as the HTML file instead, pass the --shared-js option.
To point the HTML file to a CDN hosted plotly.min.js instead, pass the --cdn-js option.
$ wily graph example.py -m loc --shared-js
